Training Registration
Many training sessions are available throughout the year. Register online using the training registration form.

The FSIT Lab is a value-added teaching and learning tool to enhance students' experience that is paramount to their future work and career.
All workshops and training sessions in the FSIT Lab include discipline-specific instruction and specialized education for students to:
These training sessions and workshops illustrate how to access existing knowledge within various outlets while utilize industry-accepted software applications and databases. Additionally, training will help students to articulate a project agenda and critically evaluate analysis and research reports.
Whether you just want to get started or fine tune your skills, the FSIT Lab will help you with a variety of training opportunities such as:
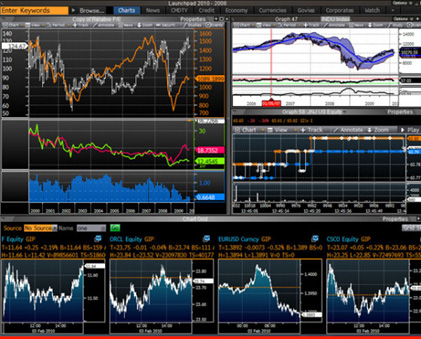
Bloomberg is one of the premier financial databases that provides extensive coverage of the global financial markets. The ability to access data quickly and to model the data in order to make crucial decisions is vital to all business professionals. Familiarity with Bloomberg terminals will give you a competitive advantage in gaining an elite internship or a job.
Goal: To provide you with knowledge, practical skills and experience in Bloomberg products. This class covers database structure and commands with a focus on real-time and historic pricing, fundamental data, customized analytics etc.
Goal: To help you use Bloomberg power to access information and perform analysis on stocks. This seminar also focuses on advanced equity analytical functions that estimate, from past data, the projected price movement of a stock relative to that of an index or another stock, the intrinsic value of a stock, the risk of bankruptcy, also the implications of changes in capital structure.
Goal: To introduce you to the FX price discovery and functions related to Spot, FWD, Cross rates and volatilities as well as to ways how to rank currencies to find cross currency investment opportunities.
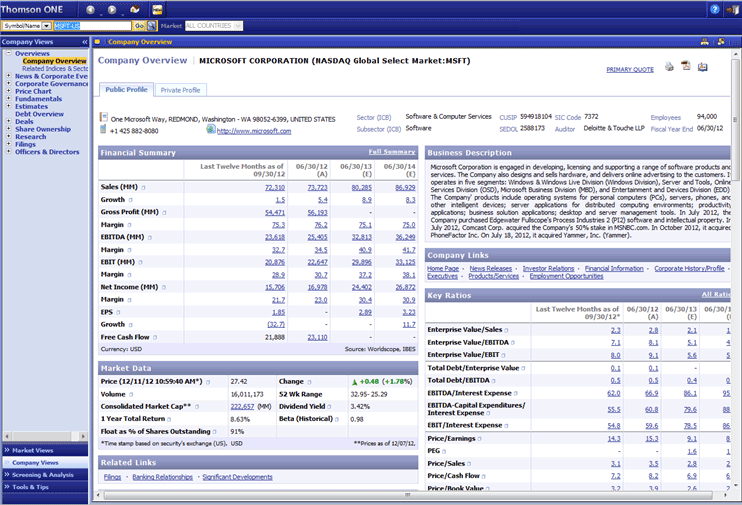
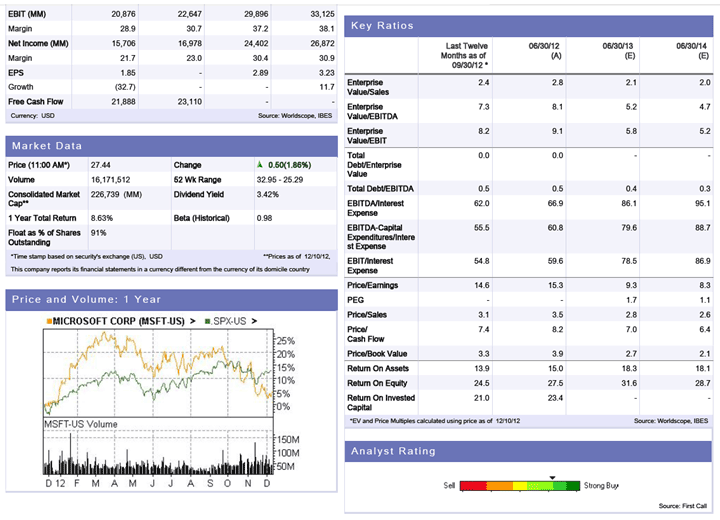
Goal: To demonstrate how to enhance the equity and bond valuation process by incorporating Thomson's proprietary ratings and value-added content for making better and faster investment decisions.
Thomson Portfolio Analytics is a comprehensive solution that provides industry-leading performance attribution, sophisticated portfolio profiling and powerful risk analysis.
Thomson Reuters Eikon is a powerful financial analysis database providing a wide range of data for over 80,000 internationally quoted companies. It offers you quick and easy access to quotes, earnings estimates, financial fundamentals, market moving news, transaction data, corporate filings, ownership profiles and research from industry-leading sources:
Goal: To discover how to use Thomson Reuters Eikon company analysis module to:
In addition to company analysis, Thomson Reuters Eikon has modules that provide data on ownership, corporate deals, which includes mergers and acquisitions (M&A) and initial public offerings (IPOs).
This Thomson Reuters Eikon training session (Comparables mode) gives you the ability to evaluate, analyze and edit pre-built sets of companies and create reports on items, such as: per share data, profitability, performance, liquidity analysis, earnings growth, comparative financials, valuation metrics, guidance list.
Goal: To demonstrate how to do a peer ratio analysis by pulling live data directly into Excel from Thomson Reuters Eikon as well as how to look for a clear progression from analyzing the historical behavior of key ratios relevant for the firm to those of the industry.
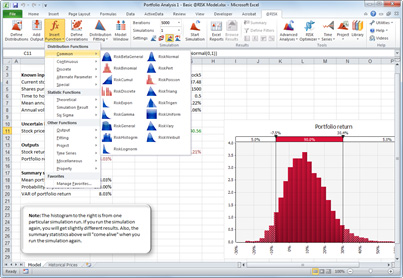
Many business decisions are based on deterministic figures that have been calculated from an analysis of some kind. Because point estimates are very dangerous, to fully understand the results we need an estimate of the uncertainty related to those figures.
The learning objectives of this training session are to understand how to use the Monte Carlo simulation to carry out uncertainty and risk analysis modeling projects.
With this knowledge students will:
Any analysis encompasses four steps:
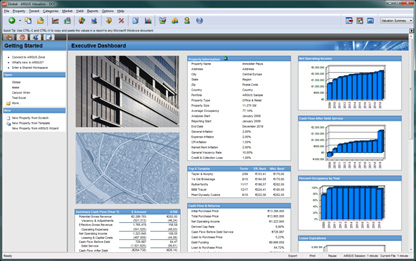
ARG猫咪社区app models all aspects of the real estate life cycle from initial acquisition, through development, to lease up, and disposition. This software provides the complete solution for managing and growing your commercial real estate portfolio. ARG猫咪社区app can also be used to value assets, view partnership structures and analyze debt financing.

Bloomberg is a professional on-line database that provides real-time and historic trading data, analytics and research, and news for global financial markets. The markets include but are not limited to government securities, corporate securities, mortgage, money-market, indices, currency, commodities and equities.
Bloomberg is used to monitor the news on a company, industry, economy. It finds stock prices and price information on commodities and currencies, as well as members of S&P 500 or other equity indices. Bloomberg is also used to build and maintain stock/bond portfolios.
The Bloomberg terminals are located in the FSIT Lab and the Mini Lab (Room T-54.)
To launch Bloomberg, click the "BLOOMBERG.INK" icon on the desktop or:
Start > All Programs >Bloomberg.
![]()
After launching Bloomberg, you will see the above page, which asks you to login and provides customer support phone numbers.

There are 5 steps to create an account:
Now you have created your account and can login, but to get the full functionality, you have to wait until you get a phone call from a Bloomberg representative. Usually, you just need to wait a few minutes.
There are three ways to logoff from Bloomberg:
SDC Platinum lets you access Securities Data Company's online databases of financial transactions. It enables you to identify comparable transactions, monitor markets and industries, prospect for new business and evaluate advisors.
SDC provides the following modules:


Capital IQ is an information and research platform for students who are pursuing their business degrees. Capital IQ helps students reduce time spent on coursework and interview-related research and analysis and broaden their universe of potential career opportunities. It is used by over 2,000 leading financial institutions, advisory firms, corporations and universities.
Coverage statistics:


Thomson ONE.com Investment Banking allows asset managers and research analysts to evaluate securities and analyze their portfolios with a solution that combines real-time market data, referential content such as research and estimates, and corporate events, transcripts and company guidance with portfolio analytics and tools in one complete platform.
Thomson Reuters Eikon is your gateway to finding Thomson Reuters data and news, pre-built screens, and much more 鈥ll in an intuitive browser-based interface.
Upon launching the application, the home screen below will provide a snapshot of the current market as well as a breakdown of asset classes and popular links.

In a single view, with Eikon you have access to:


WRDS (Wharton Research Data Services) is a gateway to financial, accounting, banking, economics, management, and marketing data accessible through a single web-based interface provided by the Wharton School of the University of Pennsylvania. Kogod's subscription includes access to Standard Poor鈥檚 Compustat Global and Compustat North America, as well as to CRSP鈥檚 daily and monthly stocks.
Standard & Poor's Compustat North America provides the annual and quarterly Income Statement, Balance Sheet, Statement of Cash Flows, and supplemental data items on most publicly held companies in the United States and Canada. Financial data items are collected from a wide variety of sources including news wire services, news releases, shareholder reports, direct company contacts, and quarterly and annual documents filed with the Securities and Exchange Commission. Compustat files also contain information on aggregates, industry segments, banks, market prices, dividends, and earnings. Depending upon the data set, coverage may extend as far back as 1950 through the most recent year-end.
The Center for Research in Security Prices (CRSP) maintains the most comprehensive collection of security price, return, and volume data for the NYSE, AMEX and Nasdaq stock markets. Additional CRSP files provide stock indices, beta- and cap-based portfolio, treasury bond and risk-free rates, and mutual fund databases.

Software for risk and decision analysis that works with Excel to provide detailed "what-if?" analysis in spreadsheet models. Widely used in operations analysis, risk management and corporate finance.
@RISK performs risk analysis using Monte Carlo simulation to show you many possible outcomes and tells you how likely they are to occur. This means you can judge which risks are worth taking and which ones to avoid, allowing for the best decision making under uncertainty.
In addition, the FSIT Lab offers the following resources for business use:
The lab offers the following statistical analysis packages:
The following information technology and management software is available in the lab:
Many training sessions are available throughout the year. Register online using the training registration form.

Contact Director of the FSIT Lab, Octavian Ionici
Phone Number: (202) 885-1947